Getting started
Quickstart
Two laps compared, race pace with the fuel taken out, and tyre wear, on real sessions, in a few minutes.
Four steps on real sessions: compare two qualifying laps, rank a race on pace with the fuel taken out, see how the tyres wore, and draw a chart. The code on this page runs top to bottom as one script.
1. Install
pip install "lapbox[plot]"The plot extra adds Plotly for step 4; the rest needs only pip install lapbox. FastF1 comes with either. If FastF1 can’t download a session, read Getting session data first.
2. Compare two laps
Load a session with FastF1, pick each driver’s fastest lap, and pass both laps’ telemetry to compare:
import fastf1
from lapbox.telemetry import compare, delta_time

session = fastf1.get_session(2025, "Silverstone", "Q")
session.load()
ver = session.laps.pick_drivers("VER").pick_fastest().get_telemetry()
nor = session.laps.pick_drivers("NOR").pick_fastest().get_telemetry()

result = compare(ver, nor, driver_a="VER", driver_b="NOR")
if result.matched:
    print(f"VER ahead by {delta_time(result.aligned).iloc[-1]:+.3f} s at the line")
    gain = result.segments.loc[result.segments["time_delta"].idxmax()]
    print(f"VER gains most from {gain.start_distance:.0f} to {gain.end_distance:.0f} m: {gain.time_delta:+.3f} s")
else:
print(f"Can't compare: laps differ by {result.residual:.0f} km/h RMS after alignment")VER ahead by +0.118 s at the line VER gains most from 2957 to 4765 m: +0.202 s
compare first puts Norris’s lap on the same points of track as Verstappen’s. Comparison.matched says whether that worked; only then do the time gap and the segments describe the drivers. delta_time ends exactly at the official lap-time gap, and Comparison.segments splits the lap at its speed peaks to show where the time changed hands. Comparing two laps has the rest.
3. Race pace, with the fuel taken out
A car gets roughly two seconds a lap quicker over a Grand Prix just by burning fuel, so raw lap times compare fuel loads as much as pace. true_pace_ranking corrects every lap to end-of-race fuel and ranks each driver’s median:
from lapbox.pace import true_pace_ranking

race = fastf1.get_session(2025, "Monza", "R")
race.load(telemetry=False, weather=False, messages=False)

pace = true_pace_ranking(race.laps)
print(pace[["driver", "corrected_median", "gap", "raw_rank", "corrected_rank"]].head(5).round(3))driver corrected_median gap raw_rank corrected_rank 0 VER 81.215 0.000 1 1 1 NOR 81.560 0.345 3 2 2 PIA 81.651 0.436 2 3 3 LEC 81.803 0.588 4 4 4 RUS 81.892 0.677 5 5
On raw medians Piastri was second and Norris third; with the fuel taken out they swap. The race needs no telemetry, so load(telemetry=False, …) is much quicker. One race proves nothing about the method — see Race pace.
4. Tyre wear
stint_degradation fits a slope through each stint’s fuel-corrected laps, and compound_summary takes the median per compound:
from lapbox.tyres import compound_summary, stint_degradation

print(compound_summary(stint_degradation(race.laps)).round(3))compound stints laps median_deg best_deg worst_deg 0 SOFT 3 20 -0.039 -0.149 0.043 1 MEDIUM 15 404 -0.001 -0.091 0.024 2 HARD 16 489 0.005 -0.026 0.061
5. Draw it
With the plot extra, a comparison draws itself: the time gap on top, then both drivers’ channels on the shared distance axis.
result.plot(channels=["Speed", "Throttle", "Brake", "nGear"]).show()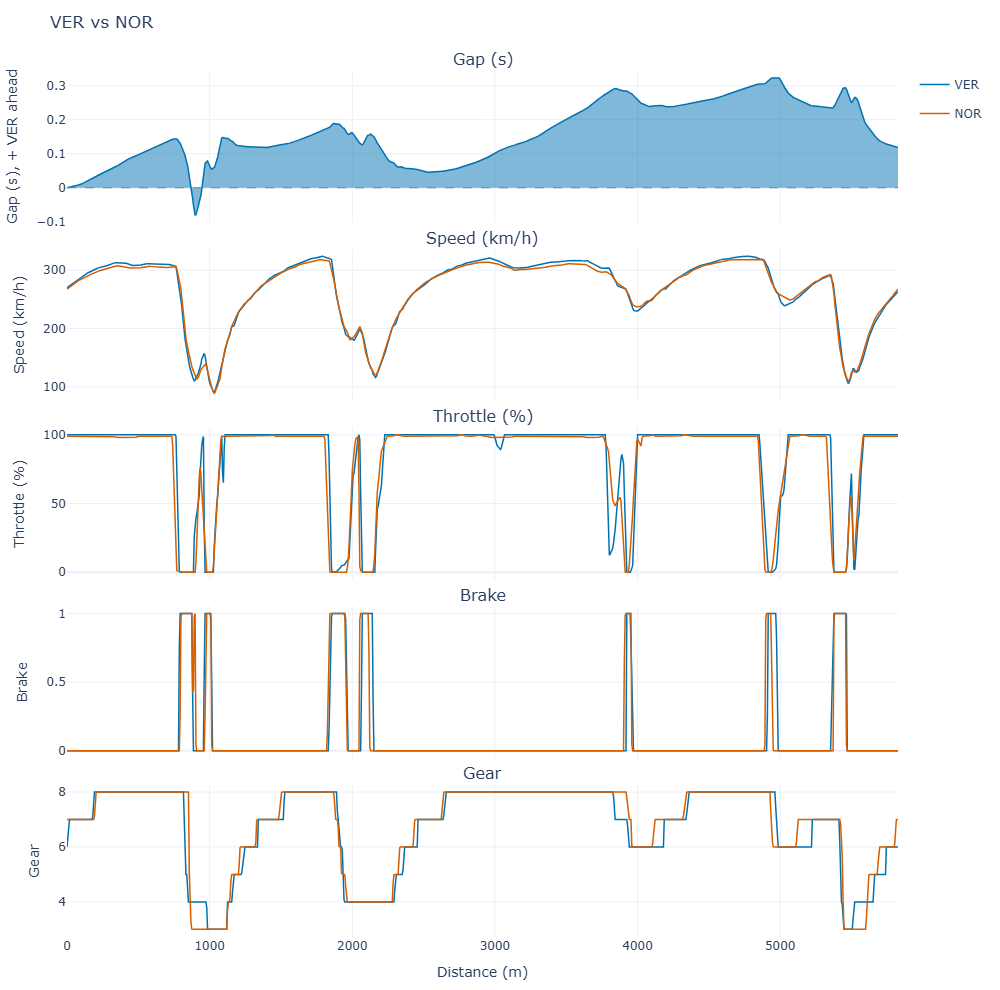
Charts shows the other figures. From here, read Core concepts for the conventions every module shares, or go straight to a guide.
These docs describe lapbox 0.1.0. Something wrong or missing? Open an issue.